The outlook for the global economy has shifted from a situation of healthy, broad-based growth across the larger economic blocks to a more nuanced view of growth perspectives, with substantial risks clouding the horizons. Considering the 12 months from 2017 Q3 to 2018 Q3, growth in the United States was 3% but many suggest that this relatively high rate will fade through 2019 as fiscal stimulus subsides, falling growth rates in other parts of the world impinge on the US, and interest rates rise to ensure that wage inflation does not feed into prices and threaten the 2% inflation target. In China, growth has been slowing as the economy rebalances away from one dominated by exports and investment towards a greater share for consumption. In Europe, growth of around 2.4% this year is expected to drift down to about 2.2% for 2019.
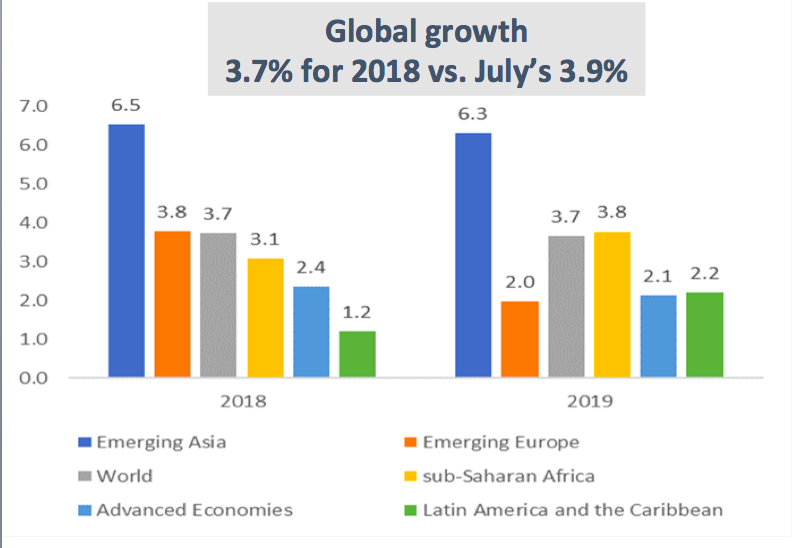
Growth in Latin America and the Caribbean is driven by global trends, domestic factors and their interaction. Unfortunately, growth in the region will be the slowest of all the major regions this year expected at just 1.2%, down from the 1.6% expected back in July. This downgrade is largely due to weaker growth in Argentina (which will experience a significant recession this year) and Brazil (with slower positive growth) while the regional average is dragged down by the situation in Venezuela which remains in a major economic crisis. Growth is expected to rise in the region as a whole, but only to 2.4% in 2019 – see Figure 1.
Figure 1. Weaker Global Growth Forecast

Wide differences across countries
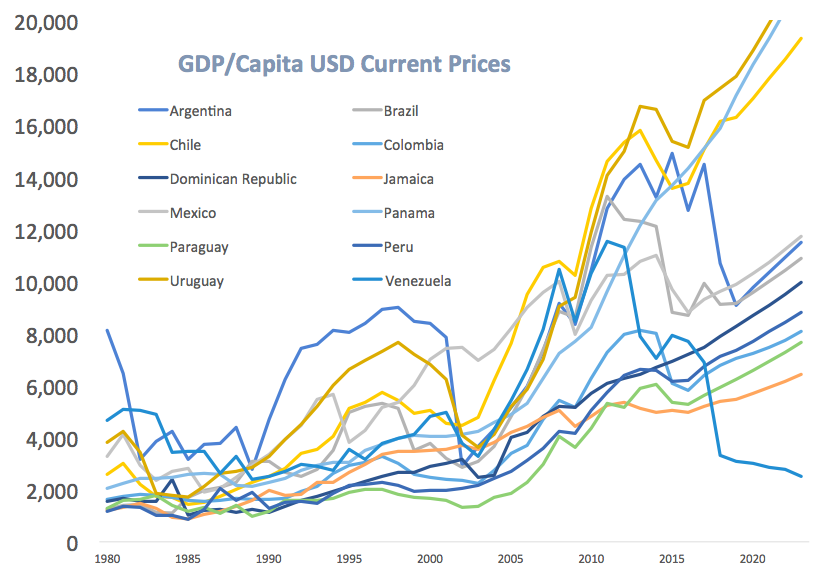
But these regional figures hide wide differences across countries. Indeed, the dispersion of income levels has been on the rise – see Figure 2 which plots GDP per capita in dollars (at current prices) for a selection of countries. One group of high performers (Chile, Panama and Uruguay) all exceed GDP per capita at current prices of US$16,000 as of 2018 and are expected to have GDP per capita of around US$20,000 by 2023. A second group has seen progress in this indicator but starting from a lower base (including the Dominican Republic, Paraguay and Peru). In the case of Peru, GDP/capita is expected to be almost US$9,000 in 2023 while it was just over US$6,000 in 2015 – and just US$2,000 in 2002.
Figure 2. Selected Growth Rates: Dispersion Rising
Countries with highly flexible exchange rates such as Colombia and Mexico saw this measure of income drop as their currencies depreciated in 2014-2015 to protect their economies from the fall in commodity prices. Mexican US$ GDP/Capita fell from 11,000 in 2014 to 8,800 in 2015 but is expected to recover to exceed 11,100 by 2023. Argentina and Brazil have seen yet more volatility in this indicator. Argentina’s 2018 income per capita of US$10,700 has fallen to close to the level of Brazil, at around US$9,200 in 2018. Both are expected to have income per capita in excess of US$10,800 by 2023.
The impact of different crises
The Venezuelan crisis is starkly evident by this measure. By the end of 2018, Venezuelan GDP per capita will have fallen by more than 70% from its peak of US$11,500 in 2011 to just US$3,300. The case of Jamaica is also worth noting. In 2010, Jamaica had GDP/capita of about US$4800 but suffered a serious fiscal crisis that reprofiled domestic debt. GDP/Capita in 2018 stands at US$5400 reflecting steady progress. What is remarkable is that this was achieved while running a primary fiscal surplus of about 7% of GDP each year with debt falling from 140% to around 100% of GDP. This must stand as one of the most successful programs of reprofiling and fiscal consolidation to date.
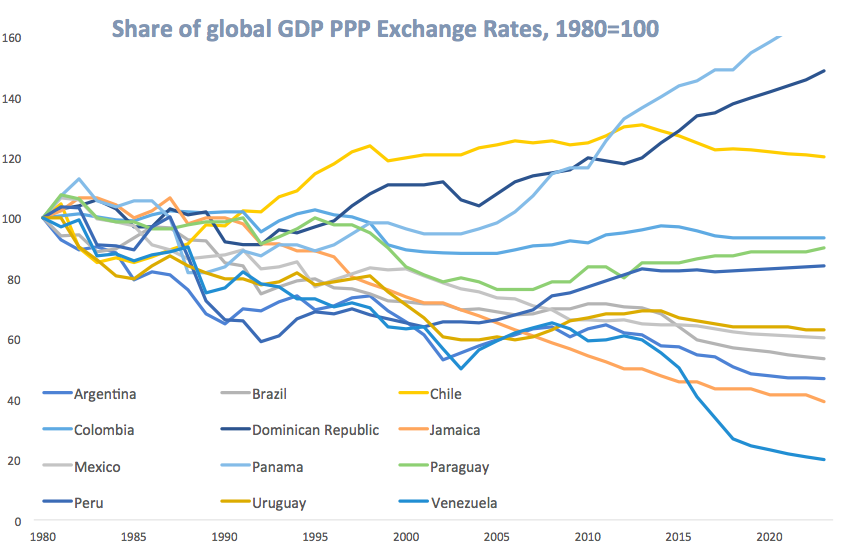
Each indicator has its pros and cons. GDP per capita in dollars at current prices indicates spending power using a standard global measure but ignores local prices. An alternative to see how countries have fared is to consider how each economy’s output (GDP) in dollars has moved but using what are referred to as Purchasing Power Parity adjusted exchange rates. Roughly speaking this means adjusting actual exchange rates to what might be considered an equilibrium level given prices in each country and those in the US. One way to then compare across countries is to see how each country’s share of global output has changed according to this measure. But the shares vary widely, so to ease the exposition I have normalized the share of each economy to be equal to 1.0 in 1980 – see Figure 3.
Figure 3. Many Countries Losing Global Output Shares

Declining shares of global output
Most countries have seen their share of global output decline. The 1980’s, known as the lost decade, saw the typical country among the IDB 26 borrowing members lose about 20% of its global output share. But the figure also shows growing dispersion. Panama, the Dominican Republic and Chile stand out as the countries that have managed to gain overall share since 1980. Colombia, Paraguay and Peru have almost regained their 1980 shares. But there are many countries that continue to lose share. Venezuela lost about 40% of its global output share between 1980 and 2012, and by 2023 its global output share is expected to be just 20% of the 1980 figure. Figure 1 also suggests that the region as a whole will continue to lose its share of global output through 2019, as expected world growth exceeds that of the region.
There are substantial risks to these projections. The US stock market has fallen significantly from its September 2018 peak, perhaps reflecting the expected fall in growth but also amid uncertainty regarding the relatively open global trading system and the ongoing process of monetary normalization. In Europe, concerns regarding the Italian fiscal position weigh on markets as does Brexit. For China there are risks to the gradual transformation of the economy particularly deriving from the debt positions of some state institutions and if global trading rules change.
The countries that have been most successful in navigating global shocks have been those that have maintained economic stability keeping fiscal deficits, debt levels and inflation in check. Many countries in Latin America and the Caribbean suffered due to the interaction of international shocks and domestic vulnerabilities.
Panama is an exceptional case where growth has been boosted due to significantly higher investment levels including in infrastructure. But as reviewed in the 2018 Latin American and Caribbean Macroeconomic Report, to boost regional growth, investment needs to be both greater and more productive. The 2019 Report to be published in March will consider how countries can maintain economic stability while confronted with higher global interest rates and a possible fall in capital flows while also focusing on how infrastructure investment can be boosted and how such investments may be selected to have the greatest impact on output.


Very good on Latin america, but more needs to be said in a report on Latin America and the Caribbean.
Thanks for sharing this valuable data
Thanks for stopping by and reading our blog, Fernando.