Inter-American Development Bank
facebook
twitter
youtube
linkedin
instagram
Abierto al públicoBeyond BordersCaribbean Development TrendsCiudades SosteniblesEnergía para el FuturoEnfoque EducaciónFactor TrabajoGente SaludableGestión fiscalGobernarteIdeas MatterIdeas que CuentanIdeaçãoImpactoIndustrias CreativasLa Maleta AbiertaMoviliblogMás Allá de las FronterasNegocios SosteniblesPrimeros PasosPuntos sobre la iSeguridad CiudadanaSostenibilidadVolvamos a la fuente¿Y si hablamos de igualdad?Home
Citizen Security and Justice Creative Industries Development Effectiveness Early Childhood Development Education Energy Envirnment. Climate Change and Safeguards Fiscal policy and management Gender and Diversity Health Labor and pensions Open Knowledge Public management Science, Technology and Innovation  Trade and Regional Integration Urban Development and Housing Water and Sanitation
  • Skip to main content
  • Skip to secondary menu
  • Skip to primary sidebar
  • Skip to footer

Abierto al público

  • HOME
    • About this blog 
    • Editorial guidelines
  • CATEGORIES
    • Knowledge Management
    • Open Data
    • Open Learning
    • Open Source
    • Open Systems
  • Authors
  • English
    • Español

How to create your own visualizations in the IDB open data portal

May 6, 2015 by Maria Violeta Bertolini 1 Comment


Leer blogpost en español

This is the second blogpost of the series of tutorials  on “Numbers for Development” 

By María Violeta Bertolini, Embedded librarian for the Institutions for Development Sector and member of the reference team at the Felipe Herrera Library of the Inter-American Development Bank (IDB)

As we announced in our previous blogpost, the Inter-American Development Bank (IDB) has launched its new Open Data Portal called “Numbers for Development”. This portal allows users to explore, visualize and reuse more than 1700 multi-sectorial indicators from 26 countries in Latin American and the Caribbean collected by the Bank for over 50 years. This open data portal offers in one single place the Bank´s data on social and economic development in Latin America and the Caribbean

Throughout this post, I will show you how to use “Numbers for Development” to create your own visualizations, download and embed them to your website.

1 Access the open data portal “Numbers for Development”

Click here to visit “Numbers for Development” or use the IDB website and click on “Data” at the top of the page. Next, select the option “Specialized Datasets” located in the Data Search Panel (blue bar).

1.Inicio

2Choose your Data

Choose a set of data that suits your interests. You can search by keywords, browse or use filters. If you search for “technology”, it will produce the following results which you can then identify as a dataset by the following icon Icono.

In this case I will choose the dataset from IDB’s flagship publication, Development in the Americas from 2011: “Development Connections: Unveiling the Impact of New Information Technologies”. Click on the title to access the dataset and start working.

2.Dataset

3Choose the variables of your preference

Use the “Filter” option to select indicators like countries, years, etc., that you may want to include in your visualization. You can include the necessary number of filters by clicking the option “Add new filter condition”. Once you complete your selection, the portal will automatically display the data that fits your criteria.

Filters

4Visualize your data

Click on “Visualize” and select the type of visualization that best helps display your data to tell your data story or test out your hypothesis:

Visualization


For example, if you choose: “Stacked Column”, you will need to define the labels and values for the selected datasets:

Visualization2
When you have more than one value, from the advanced data selection, you can group the series to show a comparison. In this case, we will compare data from years 2005 and 2010. I will then select “Year”.

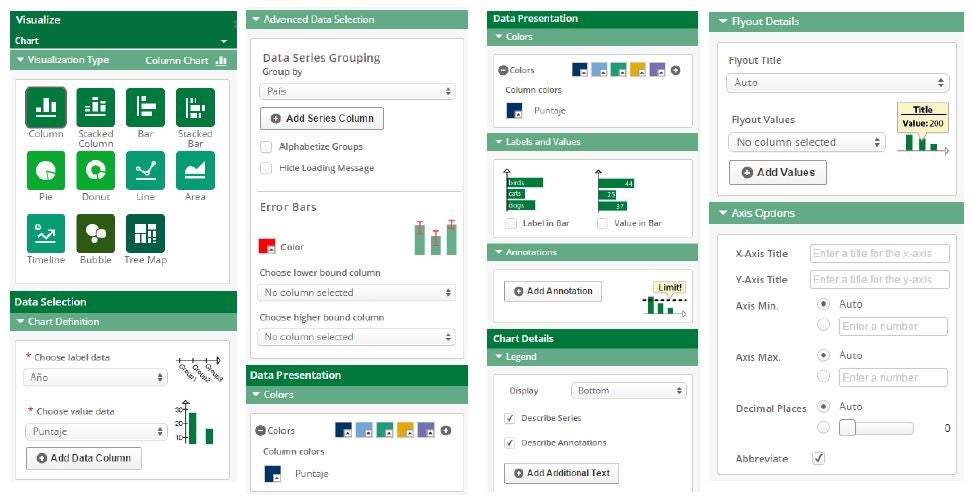
5Personalize your Visualization

Finally, you can personalize your visualization by editing the colors, labels and values, legends and axis. These options appear when you scroll down the visualization menu.

Personalize

6Save your creations and register!

Don’t forget to save your work before exiting:

Guardado
You can save your visualization in a preexisting Socrata account or create a new one:

10.Guardado2

7Share your results! Spread the knowledge!

Just a few steps is all it takes. You can create visualizations and export them to be used in reports or embed them onto your website, citing the Open Data Portal from the IDB.

Once you have saved your visualization, you can then share it on Facebook, Twitter or by email. Don’t forget to include #OpenData @the_IDB on your post and tweets to include your visualization and join the conversation on open data in Latin America and the Caribbean.

Export

Now that you know how to create visualizations, visit our portal and try it out!


[message_box title=”Highlights” color=”green”]

– Click here to access the Open Data Portal from the Inter-American Development Bank “Numbers for Development” and access data from 26 countries in the region, collected by the IDB for more than 50 years.

– Share your visualizations and follow the news about the portal on social media using #OpenData and @the_IDB

– Click here to read other blogposts about “Numbers for Development” and learn more ways to use our new portal.

– Feel free to comment below or email us at [email protected].

[/message_box]

Filed Under: Open Data Tagged With: Data Visualization, How to, Numbers for Development

Maria Violeta Bertolini

Maria Violeta es Bibliotecaria Integrada para el Sector de Instituciones para el Desarrollo (IFD) y forma parte del equipo de referencia de la Biblioteca Felipe Herrera del BID Previamente, Maria Violeta trabajó como Consultora de Gestión del Conocimiento en la División de Capacidad Institucional del Estado de IFD. Antes de incorporarse al BID en el 2013, Maria Violeta fue Directora de la Biblioteca del Centro de Economía Internacional de la Cancillería Argentina desde 2005 hasta 2012. De nacionalidad argentina, Maria Violeta posee una licenciatura en Bibliotecología y Documentación de la Universidad del Museo Social Argentino y se encuentra finalizando una Maestría en Dirección de Comunicaciones Institucionales de la Universidad de Ciencias Empresariales y Sociales en Buenos Aires.

Reader Interactions

Comments

  1. Donna Jennings-Toney says

    April 14, 2022 at 4:28 am

    The resources available on the Numbers for Development are extensive and so very instructive. Data interpretation and analysis are tasks that have been enhanced from this tutorial. Much appreciated.

    Reply

Leave a Reply Cancel reply

Your email address will not be published. Required fields are marked *

Primary Sidebar

Follow Us

Subscribe

About this blog

Open knowledge can be described as information that is usable, reusable, and shareable without restrictions due to its legal and technological attributes, enabling access for anyone, anywhere, and at any time worldwide.

In the blog 'Abierto al Público,' we explore a wide range of topics, resources, and initiatives related to open knowledge on a global scale, with a specific focus on its impact on economic and social development in the Latin American and Caribbean region. Additionally, we highlight the Inter-American Development Bank's efforts to consistently disseminate actionable open knowledge generated by the organization.

Search

Topics

Access to Information Actionable Resources Artificial Intelligence BIDAcademy Big Data Citizen Participation Climate Change Code for Development Coronavirus Creative Commons Crowdsourcing Data Analysis Data Journalism Data Privacy Data Visualization Development projects Digital Badges Digital Economy Digital Inclusion Entrepreneurship Events Gender and Diversity Geospatial Data Hackathons How to Instructional Design Key Concepts Knowledge Products Lessons Learned Methodologies MOOC Most Read Natural Language Processing Numbers for Development Open Access Open Government Open Innovation Open Knowledge Open Science Solidarity Sustainable Development Goals Taxonomy Teamwork Text Analytics The Publication Station

Similar Posts

  • 5 ways to use the IDB’s new open data portal
  • 3 new ways to explore the IDB’s Open Data Portal
  • How to filter and export data in the IDB Open Data Portal
  • 5 ways to get a snapshot of a country’s key development indicators using the IDB Open Data Portal
  • 4 Datasets to explore in Numbers for Development

Footer

Banco Interamericano de Desarrollo
facebook
twitter
youtube
youtube
youtube

    Blog posts written by Bank employees:

    Copyright © Inter-American Development Bank ("IDB"). This work is licensed under a Creative Commons IGO 3.0 Attribution-NonCommercial-NoDerivatives. (CC-IGO 3.0 BY-NC-ND) license and may be reproduced with attribution to the IDB and for any non-commercial purpose. No derivative work is allowed. Any dispute related to the use of the works of the IDB that cannot be settled amicably shall be submitted to arbitration pursuant to the UNCITRAL rules. The use of the IDB's name for any purpose other than for attribution, and the use of IDB's logo shall be subject to a separate written license agreement between the IDB and the user and is not authorized as part of this CC- IGO license. Note that link provided above includes additional terms and conditions of the license.


    For blogs written by external parties:

    For questions concerning copyright for authors that are not IADB employees please complete the contact form for this blog.

    The opinions expressed in this blog are those of the authors and do not necessarily reflect the views of the IDB, its Board of Directors, or the countries they represent.

    Attribution: in addition to giving attribution to the respective author and copyright owner, as appropriate, we would appreciate if you could include a link that remits back the IDB Blogs website.


    Privacy Policy

    Copyright © 2025 · Magazine Pro on Genesis Framework · WordPress · Log in

    Banco Interamericano de Desarrollo

    Aviso Legal

    Las opiniones expresadas en estos blogs son las de los autores y no necesariamente reflejan las opiniones del Banco Interamericano de Desarrollo, sus directivas, la Asamblea de Gobernadores o sus países miembros.

    facebook
    twitter
    youtube
    This site uses cookies to optimize functionality and give you the best possible experience. If you continue to navigate this website beyond this page, cookies will be placed on your browser.
    To learn more about cookies, click here
    x
    Manage consent

    Privacy Overview

    This website uses cookies to improve your experience while you navigate through the website. Out of these, the cookies that are categorized as necessary are stored on your browser as they are essential for the working of basic functionalities of the website. We also use third-party cookies that help us analyze and understand how you use this website. These cookies will be stored in your browser only with your consent. You also have the option to opt-out of these cookies. But opting out of some of these cookies may affect your browsing experience.
    Necessary
    Always Enabled
    Necessary cookies are absolutely essential for the website to function properly. This category only includes cookies that ensures basic functionalities and security features of the website. These cookies do not store any personal information.
    Non-necessary
    Any cookies that may not be particularly necessary for the website to function and is used specifically to collect user personal data via analytics, ads, other embedded contents are termed as non-necessary cookies. It is mandatory to procure user consent prior to running these cookies on your website.
    SAVE & ACCEPT