Inter-American Development Bank
facebook
twitter
youtube
linkedin
instagram
Abierto al públicoBeyond BordersCaribbean Development TrendsCiudades SosteniblesEnergía para el FuturoEnfoque EducaciónFactor TrabajoGente SaludableGestión fiscalGobernarteIdeas MatterIdeas que CuentanIdeaçãoImpactoIndustrias CreativasLa Maleta AbiertaMoviliblogMás Allá de las FronterasNegocios SosteniblesPrimeros PasosPuntos sobre la iSeguridad CiudadanaSostenibilidadVolvamos a la fuente¿Y si hablamos de igualdad?Home
Citizen Security and Justice Creative Industries Development Effectiveness Early Childhood Development Education Energy Envirnment. Climate Change and Safeguards Fiscal policy and management Gender and Diversity Health Labor and pensions Open Knowledge Public management Science, Technology and Innovation  Trade and Regional Integration Urban Development and Housing Water and Sanitation
  • Skip to main content
  • Skip to secondary menu
  • Skip to primary sidebar
  • Skip to footer

Abierto al público

  • HOME
    • About
    • Editorial Guidelines
  • CATEGORIES
    • Knowledge Management
    • Open Data
    • Open Learning
    • Open Source
    • Open Systems
  • Authors
  • English
    • Español

Coronavirus Impact Dashboard Toolbox: data and open-source tools to understand the pandemic’s impact in cities across Latin America and the Caribbean

May 8, 2020 by Coronavirus Impact Dashboard Team Leave a Comment


The Coronavirus Impact Dashboard Toolbox includes publicly available data sources and open-source code to process Waze for Cities data. Together, these tools are the basis for a dashboard that shows the impact of social distancing measures on mobility in Latin America and the Caribbean since the onset of the coronavirus pandemic. The code can be replicated and reused in other ways to support data-driven decision-making.

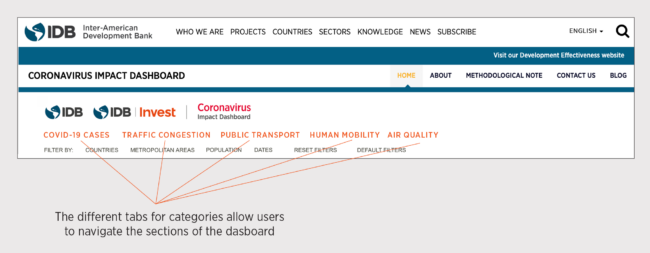
Life around the world has changed dramatically since the onset of the coronavirus. But how do we measure these changes in order to support informed policymaking across a range of topics, including the impact of different quarantine measures on social distancing and the evolution of the pandemic? To shed light on these questions, the IDB and IDB Invest developed the Coronavirus Impact Dashboard. Since the dashboard’s launch, a range of variables have been tracked on it in order to provide Latin American and Caribbean policymakers, epidemiologists, and the general public with measures of the impact of the coronavirus outbreak on people’s behavior and economic activity.

To share our work on the dashboard, we have created a GitHub repository , so that the open source community can make additional use of it mainly in two ways. First, by facilitating the access to the data used, it centralizes multiple publicly available data sources for those interested in finding raw data on  topics related to mobility and air quality, specifically for the Latin America and Caribbean region. Second, to provide code to obtain changes in Traffic Congestion Intensity (TCI) using Waze data. For those who are participants in the Waze for Cities Program Waze for Cities Program, this is an open resource to process the raw data provided by the program.

Joining up data

On the Coronavirus Impact Dashboard, the joining up of different data sources, many of which are open, has allowed us to generate intuitive real-time visualizations of social distancing’s impact on various aspects of daily life in Latin America. This concrete evidence derives from data sources on traffic congestion based on Waze data, public transportation use based on Moovit data and public information on specific systems, human mobility obtained from aggregated cell-phone data, and air quality extracted from satellite data. More sources of information will be added to the dashboard in next releases.

The data used on the dashboard can be accessed through the links in the Use the Data section of the Readme file. The traffic congestion data, for example, is updated every day and includes 60+ metropolitan areas from the LAC region. It can be filtered by country, metropolitan area, population and dates. We have also provided a methodological note about how multiple data sources are used on the Coronavirus Impact Dashboard and the methods behind each measurement.

Open-source code for Waze for Cities data

In the case of traffic congestion data, the IDB Group has collaborated with the Waze for Cities Program since 2018 in order to provide insights for informing data-driven decision-making and design of development projects. The Waze for Cities Program provides access to aggregated raw data from a continuous feed every two minutes from the Waze community-driven navigation app.

The code was developed to facilitate the processing and calculation of a measure of traffic congestion, Traffic Congestion Intensity (TCI). The code calculates the percentage change in TCI with respect to a reference week (March 2 to 8) prior to the beginning of the social distancing measures being enacted by different countries and cities in response to the coronavirus crisis. In order to prepare this data for more insightful analysis, this tool automizes and streamlines the data wrangling process, including the querying of the data based on provided polygons, the validation of the variability of the data, and the calculation of the changes in TCI.

The benefit of using the Waze data is its periodicity. With this data, we can observe the traffic congestion situation across a given city’s streets every two minutes. But, as good as this high periodicity is, it also means having lots of data to deal with. The main issue is not only the volume of data, but also thinking of a way to easily convey the overall traffic situation of a city or area, without requiring much data cleaning or pre-processing to be able to show this daily.  As the TCI only requires adding up all the congestion in a polygon during a period (say, during a day), this code can very quickly summarize the change in congestion in a city daily, in a way that is intuitive and simple to calculate.

The code can be reused by the thousand plus cities and other public and private sector partners in the Waze for Cities Program in order to prepare Waze data and create their own dashboards to inform decision making and to share focused information with their citizens. A step-by-step guide is also available in the GitHub repository in order to reproduce the TCI with the infrastructure made available by Waze to their partners.

Moving forward, we plan for further improvements and continued exploration to combine additional data sources for new insights. These include different aggregations of the TCI, including weekdays v. weekends, time of the day, socioeconomic status of users and points of interest. We will also explore adding information about accidents, traffic hazards, and other road safety measures, provided by Waze’s alerts functionality.

Other variables which could be explored with additional open data sources could be related to: economic activity, additional measures of air pollution, city walkability, and areas GDP recovery, among others.

If you have ideas for collaboration, we invite you to contact us through the repository.

By Coronavirus Impact Dashboard Team

The dashboard team leaders are Oscar Mitnik from IDB and Patricia Yañez-Pagans from IDB Invest. The dashboard technical team is comprised of João Carabetta, Mattia Chiapello, Maria Paula Gerardino, Daniel Martinez, Edgar Salgado, Luciano Sanguino, and Beatrice Zimmerman.


Filed Under: Open Source Tagged With: Actionable Resources, Coronavirus

Coronavirus Impact Dashboard Team

The dashboard team leaders are Oscar Mitnik from IDB and Patricia Yañez-Pagans from IDB Invest. The dashboard technical team is comprised of João Carabetta, Mattia Chiapello, Maria Paula Gerardino, Daniel Martinez, Edgar Salgado, Luciano Sanguino, and Beatrice Zimmerman.

Reader Interactions

Leave a Reply Cancel reply

Your email address will not be published. Required fields are marked *

Primary Sidebar

Follow Us

Suscríbete

About this blog

Open knowledge is defined as knowledge that is accessible, freely used, and free to its user. This concept is part of a movement that seeks to generate solutions for public good in a collaborative manner. In "Abierto al Público" we explore the use of open knowledge through data, code and other media.

Search

Explorar temas

Access to Information Actionable Resources Artificial Intelligence BIDAcademy Big Data Citizen Participation Climate Change Code for Development Coronavirus Creative Commons Crowdsourcing Data Analysis Data Journalism Data Privacy Data Visualization Development projects Digital Badges Digital Economy Digital Inclusion Entrepeneurship Events Gender and Diversity Geospatial Data Hackathons How to Instructional Design Key Concepts Knowledge Products Lessons Learned Methodologies MOOC Most Read Natural Language Processing Numbers for Development Open Access Open Government Open Innovation Open Knowledge Open Science Solidarity Sustainable Development Goals Teamwork Text Analytics

Similar Posts

  • Data Collaboratives: exchanging data to create public value across Latin America and the Caribbean
  • Code for Development: three years of open-source solutions without borders
  • Meet the Atypical Data Classifier, a system to review data quality for social programs
  • 8 projects from the USAID Hackathon that help understand crime in Latin America and the Caribbean
  • Coronavirus: resources and open knowledge to collaborate in response to the pandemic

Footer

Banco Interamericano de Desarrollo
facebook
twitter
youtube
youtube
youtube

Blog posts written by Bank employees:

Copyright © Inter-American Development Bank ("IDB"). This work is licensed under a Creative Commons IGO 3.0 Attribution-NonCommercial-NoDerivatives. (CC-IGO 3.0 BY-NC-ND) license and may be reproduced with attribution to the IDB and for any non-commercial purpose. No derivative work is allowed. Any dispute related to the use of the works of the IDB that cannot be settled amicably shall be submitted to arbitration pursuant to the UNCITRAL rules. The use of the IDB's name for any purpose other than for attribution, and the use of IDB's logo shall be subject to a separate written license agreement between the IDB and the user and is not authorized as part of this CC- IGO license. Note that link provided above includes additional terms and conditions of the license.


For blogs written by external parties:

For questions concerning copyright for authors that are not IADB employees please complete the contact form for this blog.

The opinions expressed in this blog are those of the authors and do not necessarily reflect the views of the IDB, its Board of Directors, or the countries they represent.

Attribution: in addition to giving attribution to the respective author and copyright owner, as appropriate, we would appreciate if you could include a link that remits back the IDB Blogs website.


Privacy Policy

Copyright © 2023 · Magazine Pro on Genesis Framework · WordPress · Log in

Banco Interamericano de Desarrollo

Aviso Legal

Las opiniones expresadas en estos blogs son las de los autores y no necesariamente reflejan las opiniones del Banco Interamericano de Desarrollo, sus directivas, la Asamblea de Gobernadores o sus países miembros.

facebook
twitter
youtube
This site uses cookies to optimize functionality and give you the best possible experience. If you continue to navigate this website beyond this page, cookies will be placed on your browser.
To learn more about cookies, click here
x
Manage consent

Privacy Overview

This website uses cookies to improve your experience while you navigate through the website. Out of these, the cookies that are categorized as necessary are stored on your browser as they are essential for the working of basic functionalities of the website. We also use third-party cookies that help us analyze and understand how you use this website. These cookies will be stored in your browser only with your consent. You also have the option to opt-out of these cookies. But opting out of some of these cookies may affect your browsing experience.
Necessary
Always Enabled

Necessary cookies are absolutely essential for the website to function properly. This category only includes cookies that ensures basic functionalities and security features of the website. These cookies do not store any personal information.

Non-necessary

Any cookies that may not be particularly necessary for the website to function and is used specifically to collect user personal data via analytics, ads, other embedded contents are termed as non-necessary cookies. It is mandatory to procure user consent prior to running these cookies on your website.

SAVE & ACCEPT