Este artículo está también disponible en / This post is also available in: Spanish
The way our cities are designed and planned significantly impacts our quality of life. Whether we are aware of it or not, factors such as commute time, access to parks and green areas, availability of schools, and pedestrian zones all contribute to our well-being. So, why not leverage all available means to enhance our cities?
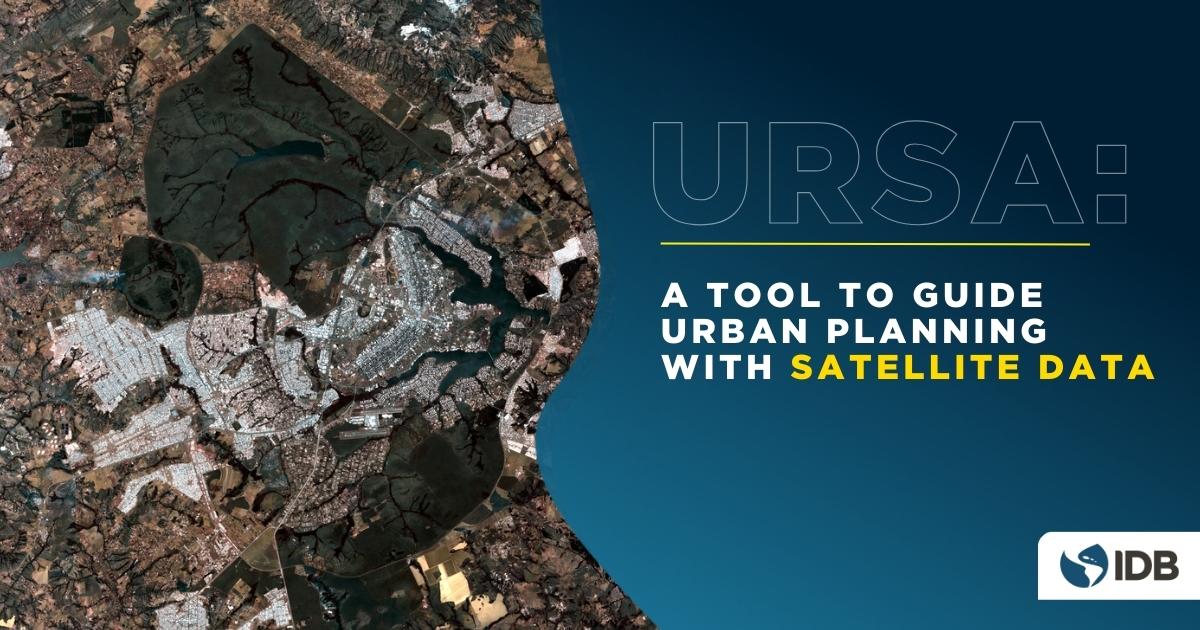
At the Inter-American Development Bank (IDB), we work tirelessly to improve lives in Latin America and the Caribbean. Consequently, within the IDB’s Housing and Urban Development Division’s City Lab, we support municipalities in the region with access to new technologies that enable innovative city design and planning. One such tool is URSA (Urban Reporting based on Satellite Analysis), a digital system utilizing satellite images with diverse applications aimed at making our cities better places to live. Read on to discover all the details!
Open Data in Urban Planning
Urban planners can enhance their ability to diagnose and guide city growth through access to new technologies and vast data sources. Open data, in general, and data obtained through satellite records, in particular, offer numerous applications for urban planning.
These data not only revolutionize the capacity to study our metropolitan areas but also support more informed and strategic decision-making for sustainable urban development. However, a significant obstacle limits access to these resources: technical complexity, which often requires specialized personnel and equipment beyond the reach of local management teams.
URSA: An Open-Source Application Democratizing Access to Satellite Sensor Data
The IDB City Laboratory and the Center for the Future of Cities at the Tecnológico de Monterrey joined forces to help urban governments bridge the gap between the potential of open data and its technical complexity for analysis.
The mission of this collaboration was to design a platform allowing municipal teams to easily produce updated territorial diagnostics based on satellite data, in the appropriate format and with the desired geographic resolution. The result is URSA, a digital system that simplifies access to a vast amount of information captured by satellite sensors, collecting, processing, and presenting key information on the evolution of cities in Latin America and the Caribbean.
URSA is part of the Open Urban Planning Toolbox, a collection of open tools for urban planning developed by the IDB City Lab, and it effectively complements other components like UrbanPy and MAIIA. Among its functions, URSA measures the evolution of metropolitan areas, accessing historical records of satellite images that document urban sprawl over time. It also identifies with high spatial precision the presence of urban heat islands—inhabited areas experiencing higher daytime temperatures than surrounding areas due to factors such as the lack of green spaces and building characteristics.
URSA’s applications go beyond current data measurement. The application allows simulating future growth trends to compare scenarios where the city continues consuming surrounding land at the historical rate or achieves densification to “grow inward,” with resulting carbon footprint calculations. This helps estimate the greenhouse gas emissions that could be avoided with incentives to develop a more compact and efficient city.
How to Access URSA
To support decision-making, planning, and management processes in cities and metropolitan regions, URSA is available as open-source software, freely downloadable from the IDB’s open-source repository. Documentation with instructions for installation and usage is also shared on the repository.
An Example of Using URSA
To illustrate how to make the most of URSA, let’s provide an example of its usage. In this case, we will describe accessing a map of land use distribution in a metropolitan area, calculated based on recent satellite image analysis.
Upon initiating the tool, we access a dropdown menu allowing the selection of the city to analyze. Is my city included? Currently, the tool covers all cities in Latin America and the Caribbean with a population exceeding 100,000, so it’s highly likely that it is included in URSA.

In this example, we select the city of La Plata in Argentina. Clicking “Consult” and then the “Land Cover” icon initiates the automatic download of information updated in the last few days.

The process may take a few minutes due to the volume of involved information. Upon completion, a dashboard is generated, presenting a map alongside metrics comparing various detected land uses, including a year-to-year historical evolution.

Once in this section, you can explore the region with the interactive map, zoom in on areas of interest, and check details about the source (in this case, the Dynamic World initiative’s database) and estimation methodology in the “Info” section.
Can the data be downloaded? For specialized audiences like urban planning teams, wanting access to a download of data compatible with geospatial analysis applications (such as QGIS or ArcGIS) to combine with other commonly used layers in the municipality, the “Downloadables” section is offered, enabling data export in standard format for use with other tools.
URSA: An Ally in Detecting Urban Heat Islands
URSA operates similarly to the previous example for various analyses, such as measuring urban sprawl or estimating population density, among others. Next week, we will explain how cities can use URSA to detect urban heat islands. Meanwhile, if you enjoyed this article, we recommend signing up for our newsletter here, or following us on LinkedIn, Facebook, and Twitter to stay updated on our efforts to improve lives in the region.


Leave a Reply