
Leer blogpost en español By Derk Steemers, CMO of Place I Live The startup PlaceILive.com uses open data in order to help its users make better informed decisions on where to live. PlaceILive has its tools live for New York, Chicago and San Francisco in the United States, plus Berlin and London in Europe. The open data comes from sources like the US Census, NYPD, MTA, … [Read more...] about How Open Data can help people decide where to live?
Data Visualization
Data visualization involves the use of graphics to present and interpret information and/or data. This tag brings together all the articles written in Abierto al Público on data visualization, including toolkits, strategies for visualization internal and external to the IDB, and other relevant information.
How to create your own visualizations in the IDB open data portal
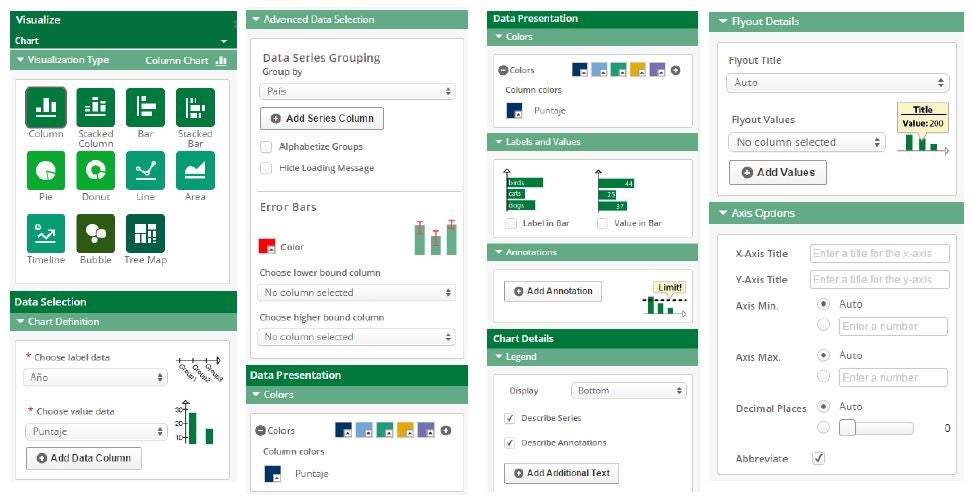
Leer blogpost en español This is the second blogpost of the series of tutorials on “Numbers for Development” By María Violeta Bertolini, Embedded librarian for the Institutions for Development Sector and member of the reference team at the Felipe Herrera Library of the Inter-American Development Bank (IDB) As we announced in our previous blogpost, the Inter-American … [Read more...] about How to create your own visualizations in the IDB open data portal
10+ ways big data can improve people’s lives
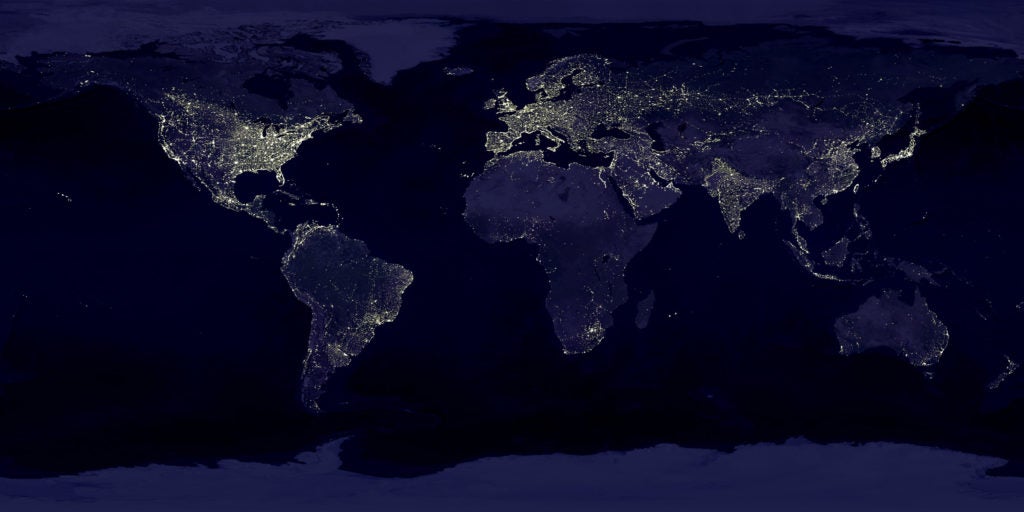
Español The UN High-Level Panel on the Post-2015 Millennium Development Agenda concluded that we need a data revolution to achieve newly established urgent development goals such as eradicating poverty. The impact of big data for development can be major and we need to be aware of its new opportunities. Here are some examples that illustrate how big data can improve … [Read more...] about 10+ ways big data can improve people’s lives