Organic agriculture is a rapidly expanding market that can provide countries in Latin America and the Caribbean (LAC) with opportunities to differentiate their products and diversify their foreign sales away from commodities.
To understand this potential, we examine the effects of organic certification on firms’ foreign sales. In so doing, we focus on two Latin American exporting countries: Argentina, the country with the largest area of agricultural farmland in the region; and Peru, the country with the most organic producers in the region. On the importing side, we concentrate on the United States, which accounted for approximately 42% of worldwide retail sales of organic foods and drinks – by far the largest organic market in the world in 2019 (FiBL-IFOAM, 2021). We explore how USDA organic certification affects overall firms’ exports and their different components, especially export prices (unit values). The evidence suggests that USDA organic certification is associated with a 20% increase in sales to the United States. This increase can be traced back to larger volumes, more frequent shipments and, importantly, higher unit values.
Organic Agriculture and Certification
Demand for organic products has expanded at an accelerated pace over the last two decades. Worldwide organic food and drink retail sales grew seven times since 2000 to reach almost US$ 120 billion in 2019. The number of organic producers and area of organic farmland have evolved accordingly and topped 3 million and 72 million hectares (HA), up from 200,000 and 11 million HA 20 years ago, respectively. LAC countries are key players in this growth, hosting 7% of organic producers and 11.5% of organic agricultural land in 2019 (FiBL-IFOAM, 2021).
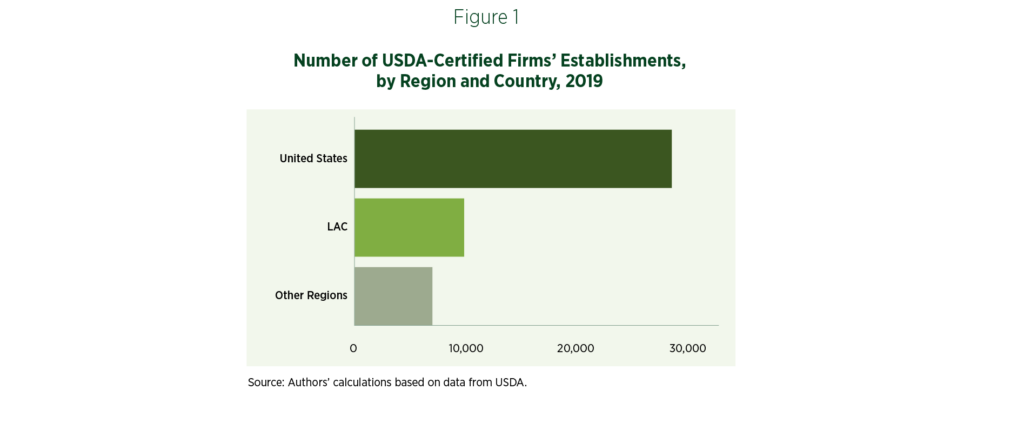
Firms must be certified to label and sell their products as organic. This requires undergoing a formal process through which an official certification body verifies that the firm complies with regulations in the country in question (e.g., US Department of Agriculture –USDA- in the United States).[1] Consistent with demand expansion, the number of certified firms has increased substantially in recent years. For instance, the total number of establishments certified as organic by the USDA exceeded 44,500 in 2019 after growing approximately 65% since 2013. LAC firms accounted for 21% of this total (Figure 1).

Organic-Certified Firms Are Increasingly Important Actors in Agricultural Exports
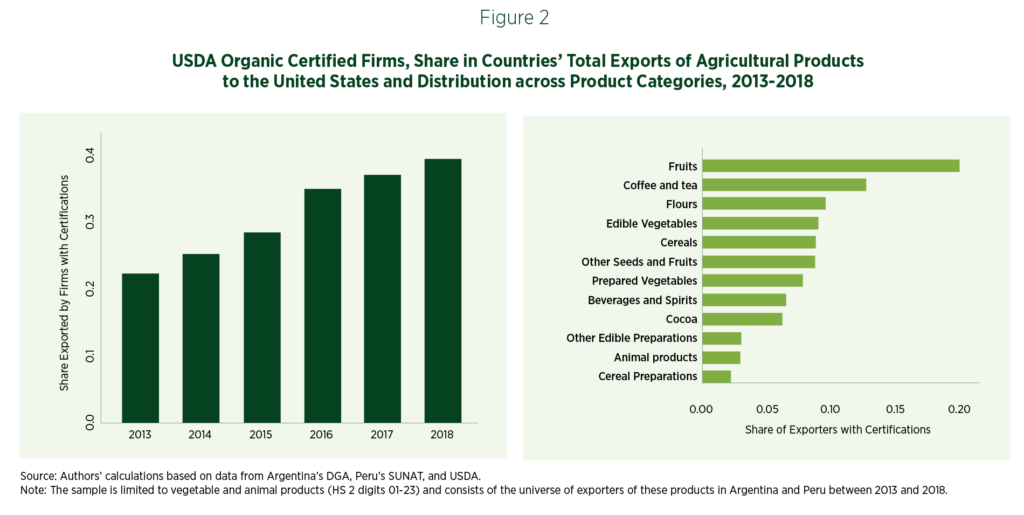
Firms certified as organic by the USDA accounted for roughly 40% of Argentina’s and Peru’s total exports of agricultural products in 2018, almost doubling since 2013 (Figure 2, left panel). USDA-certified firms were concentrated in a handful of agricultural product categories and the largest of these categories were fruits, coffee/tea, and flours (Figure 2, right panel).

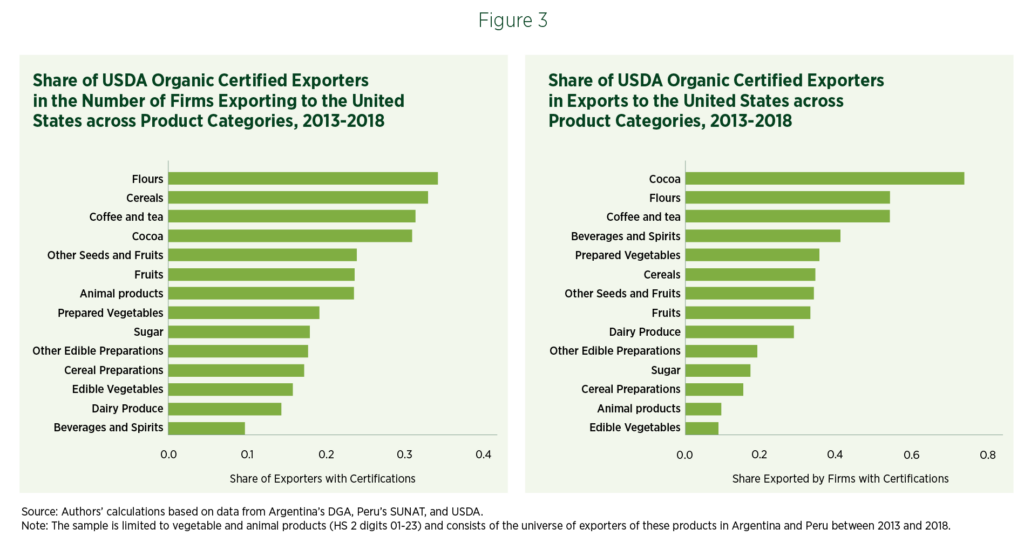
Organic certified firms were responsible for a disproportionate share of countries’ total exports of specific product groups. For instance, USDA-certified firms accounted for just 30% of the total number of cocoa exporters but approximately three-fourths of total exports of cocoa products from Argentina and Peru. Similarly, USDA-certified firms represented 30% of exporters selling flours and coffee/tea yet generated more than 50% of the respective total export values. This suggests a relatively high concentration of exports in certified firms in these sectors. In contrast, only 35% of the fruit exports were associated with the roughly 25% certified firms, thus indicating a more even distribution of these sales (Figure 3, right panel).

Organic-Certified Firms Sell More and at Higher Prices
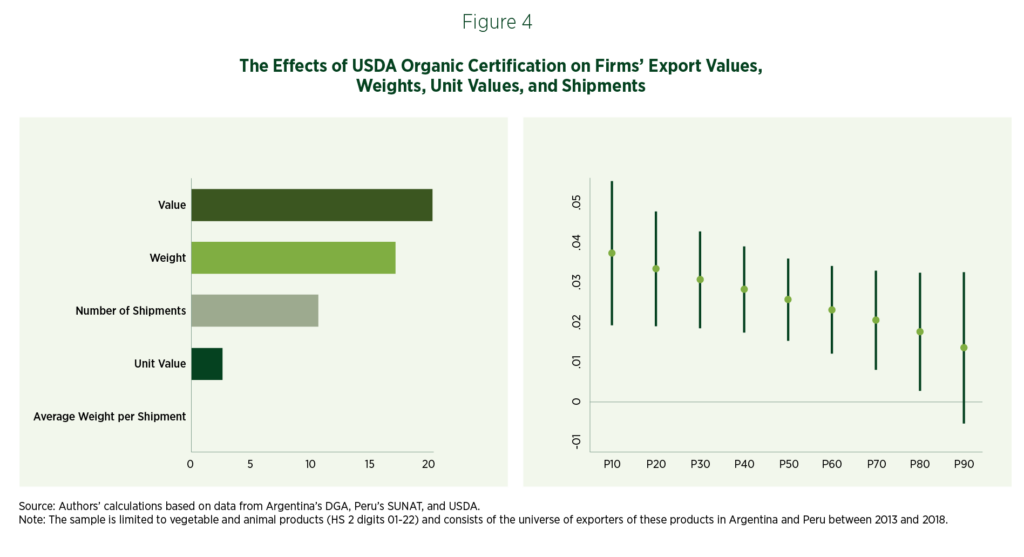
Organic-certified firms registered higher foreign sales, even after controlling for differences across firms and their products over time (e.g., changes in firms’ productivity in producing specific goods) and across destination countries and sectors over time (e.g., changes in countries’ demand for goods in given sectors). In particular, exports to the United States were 20.3% larger for firms with USDA organic certification. The increase in export value arises from the growth in export volumes, primarily because of more frequent shipments and a rise in unit values (Figure 4, left panel). Furthermore, we find that producers selling goods for less than their peers seem to gain the most from certification (Figure 4, right panel).[2]

Countries Need More Data and Analysis to Design Organic Agriculture Policies
The expansion of organic agriculture can provide opportunities for developing countries to diversify their exports. This can benefit smaller producers, thereby reducing poverty in rural areas and helping the environment through the adoption of more sustainable practices.
For these benefits to materialize, countries should implement policies that address the possible market failures that can prevent producers from getting certified. This could include reducing information barriers that firms typically face when looking for business opportunities abroad and assessing the costs and conditions to obtain organic certifications and the advantages thereof. The same applies to the coordination problems that may arise in the provision of the necessary training to address these barriers and help firms upgrade to meet relevant organic requirements.
Trade promotion agencies can play an important role in this regard. For instance, in 2018, Costa Rica’s PROCOMER launched a “Green Growth Program” to assist firms in improving their sustainability practices and outcomes through adequate changes in their production processes. This program is now supported by the Inter-American Development Bank through the Integration and Trade Sector and includes organic products as one of the priority criteria for eligibility, thus connecting sustainability and organic agriculture.
Facilitation of organic trade through international agreements (e.g., Mutual Recognition Agreements -MRAs- between countries) is another important area in which countries should keep working. For example, Chile has already signed and implemented these types of agreements with several partners.
To properly design these policies and ensure their effectiveness, countries need to systematically collect firm- and transaction-level data on agriculture, including on primary producers, their suppliers, customers, and intermediaries. They should use these data to perform periodic research and impact evaluation of the relevant programs; and conduct regular benchmarking to identify best international practices.
The IDB is supporting LAC countries in implementing this agenda. An important initiative in this regard is LAC Flavors, an annual food and beverage business forum that the Integration and Trade Sector has held 12 times throughout the region since 2009. During these forums, buyers from as far as Dubai closed deals with suppliers from LAC. This was, for instance, the case with Organic Rainforest, a Peruvian producer and exporter of organic cacao, which has been able to open new markets and differentiate its products by getting organic, kosher, and fair-trade certifications.
[1] There is an increasing number of mutual recognition agreements (MRAs) between countries (e.g., between the United States and the European Union).
[2] In other words, unit values below the median drove the impact of organic certifications on unit values. This is consistent with available empirical evidence, according to which initially lower quality farmers tend to benefit more from certification than their higher-quality counterparts who can already obtain good prices.
[3] The dependent variables are (the natural logarithms of) those that appear in the y-axis, and the main explanatory variable is a binary indicator that takes the value of one for the United States if the firm is certified as organic by the USDA in the year in question and zero otherwise along with firm-product-destination, firm-product-year and destination country-product-year fixed effects. Estimated effects that are not significantly different from zero at the 10% level are reported as zero. The figure on the right presents quantile fixed effect estimates for the (natural logarithm of the) unit values. In the figure on the left, estimated percentage effects are shown, i.e., [exp(estimated coefficient on USDA organic certification)-1]x100, whereas in the figure on the right direct estimates are presented.


Leave a Reply