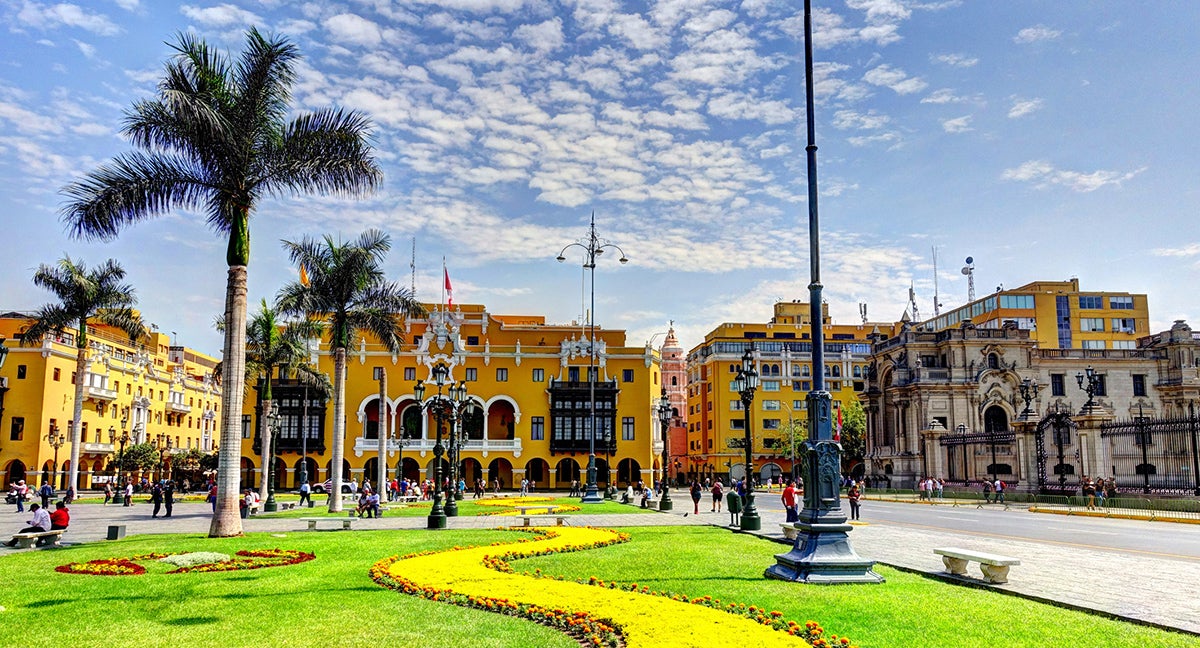
At the end of March, people in Lima saw something truly out of the ordinary: clear blue sky. Famous for its ever-present grey haze, Lima is one among many cities that have experienced a noticeable improvement in air quality as social distancing measures to combat the coronavirus have made people stay home and businesses change how they operate.
While social distancing appears to be slowing the spread of the virus in other regions of the world, it is still too early to draw conclusions about Latin American and the Caribbean given the delayed arrival of COVID-19 to the region. Monitoring changes in air quality could give us a general approximation of the extent to which entire economies are slowing down.
Air quality measures are based on the concentrations of common pollutants. One of these, nitrogen dioxide (NO2), comes from the burning of fossil fuels by cars, buses, power plants, households, industrial facilities, and other sources. High concentrations of NO2 in the air can have adverse effects for both human health and the environment.
Today, NO2 can be measured globally thanks to data captured by the Copernicus Sentinel-5P satellite. Results already show that the coronavirus crisis has decreased NO2 pollution in China and Europe, where lockdowns have been put in place.
How is air quality changing in Latin America and the Caribbean?
We analyzed the same data for 11 cities in the region and observed notable declines in NO2 concentration levels, particularly in cities that have implemented total lockdowns (Figure 1). For this analysis, we compared the NO2 levels in the last 10 days of March 2020 (March 22-31) with those observed in the first 10 days of the month (March 1-10). The first days of March are used as a benchmark, or business as usual scenario, as COVID-19 cases were still low in the region and almost no measures of social distancing had been implemented by countries at that time.
The results from all this analysis are already published in our Coronavirus Impact Dashboard in a new section called “Air Quality”.
Figure 1. Change in NO2 concentration levels using satellite data
Last 10 days v. First 10 days of March 2020
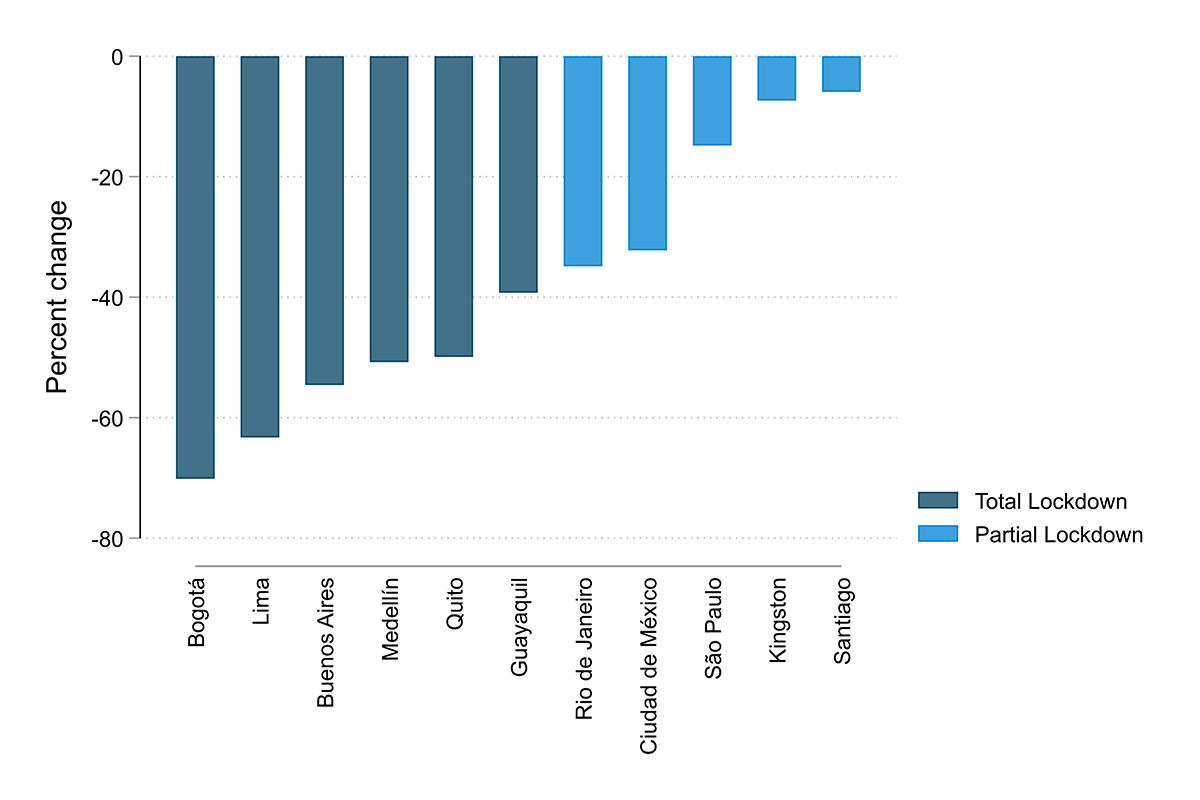
Source: Reports modified information extracted from Copernicus Sentinel Data (2020), processed by the IDB Group.
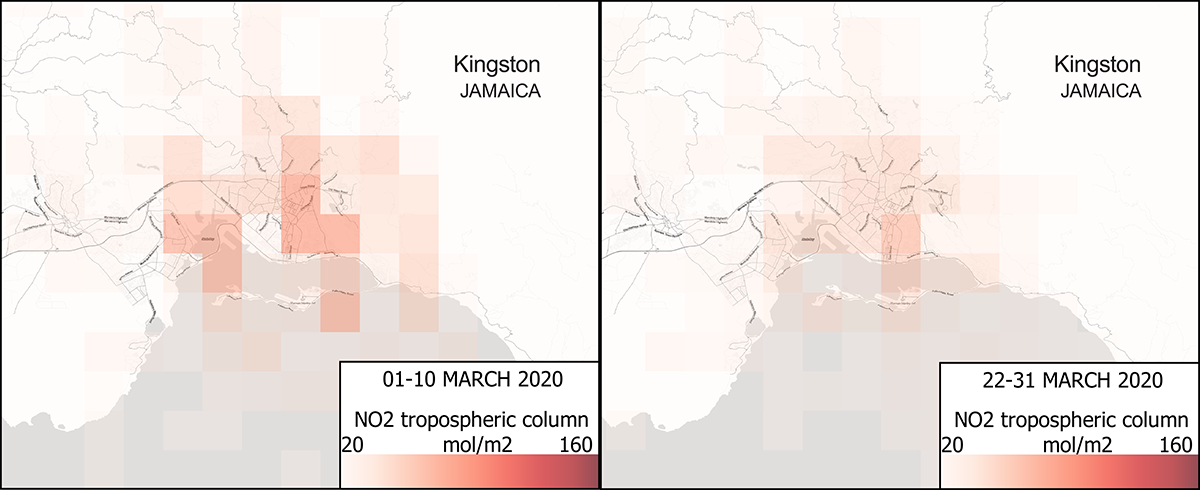
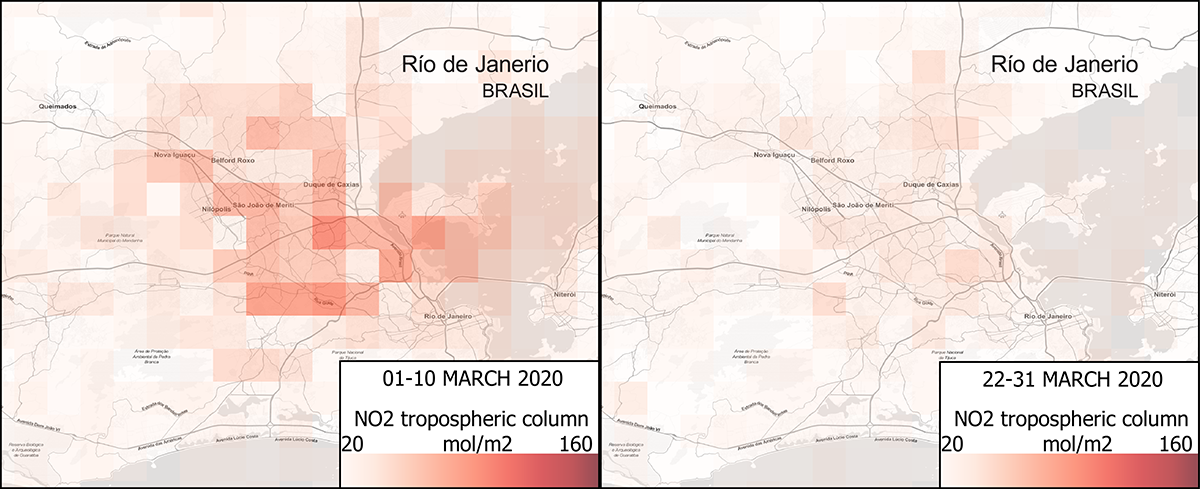
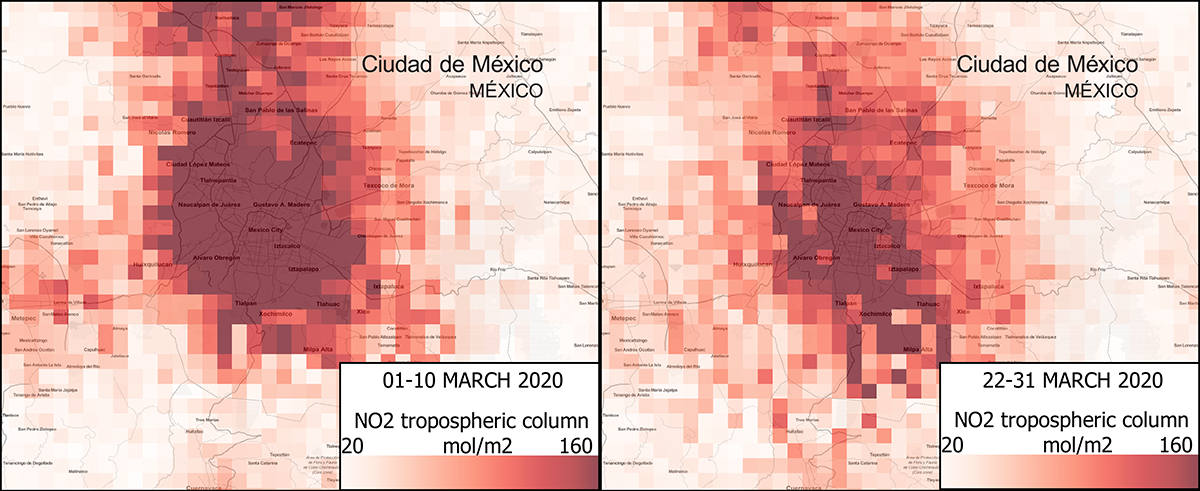
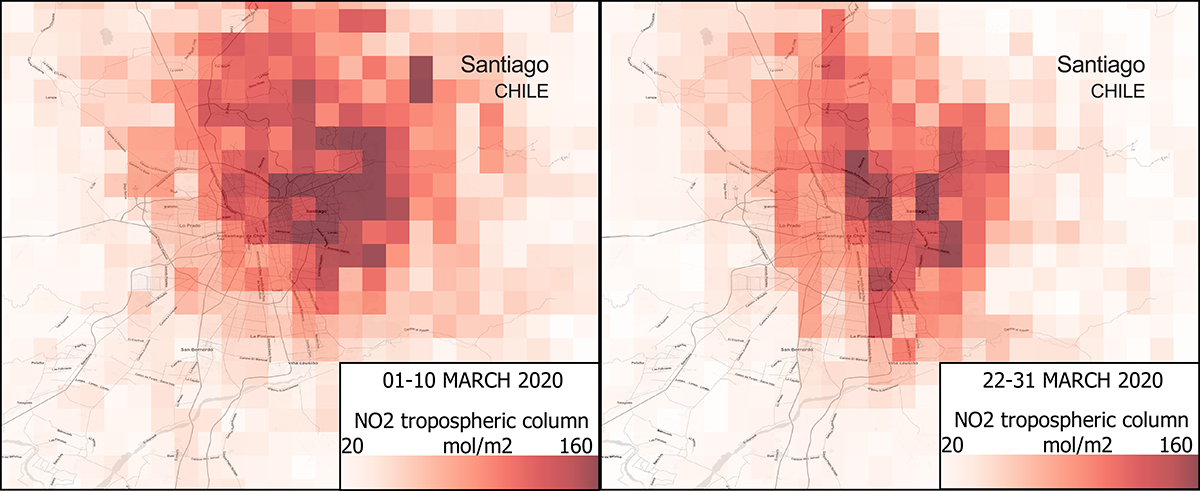
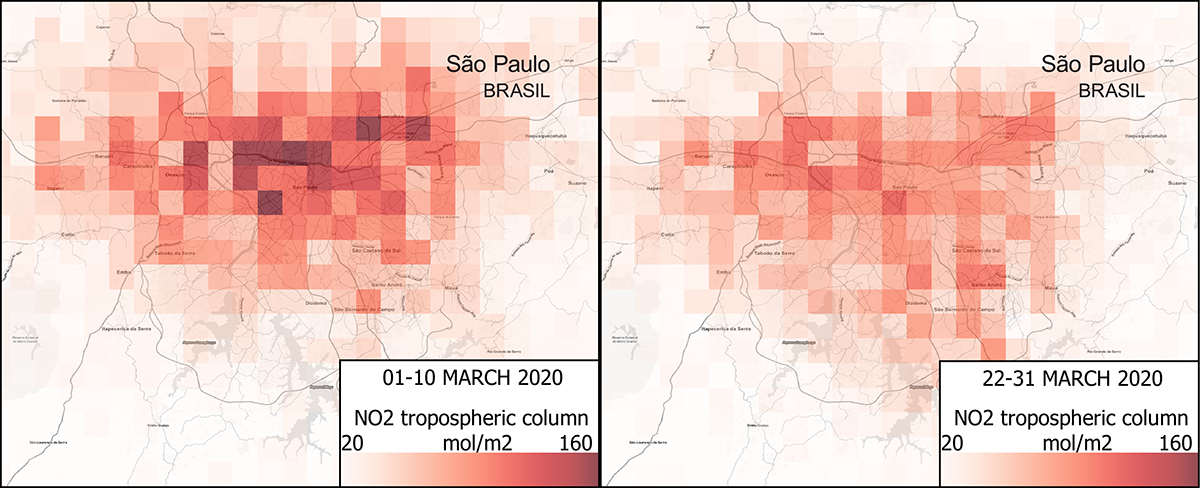
The side-by-side visual comparisons are even more stark in cities where total lockdowns are in place (Figure 2). For cities with less strict social distancing measures, the picture is more mixed (Figure 3). In some cities, such as Rio de Janeiro, there are marked decreases in NO2 concentration. In others, such as Santiago, Mexico City, and São Paulo the changes are less pronounced.
Figure 2. NO2 concentration changes in cities in countries with total lockdowns
Last 10 days v. First 10 days of March 2020
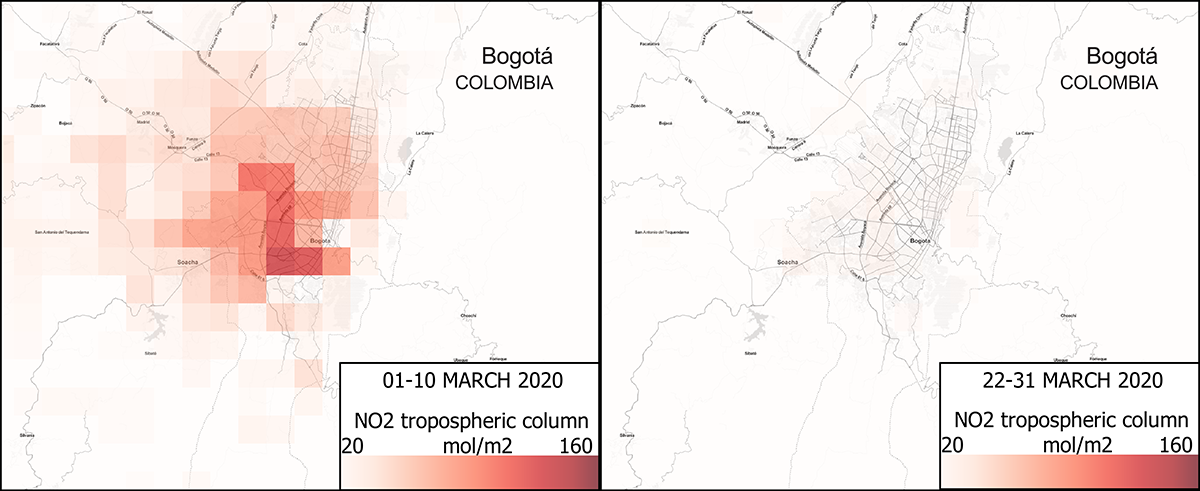
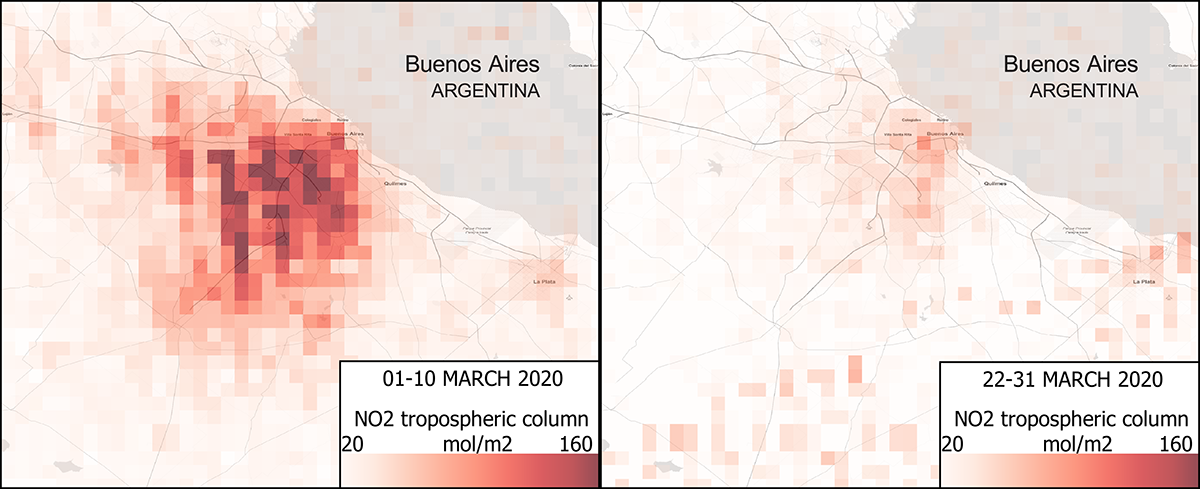
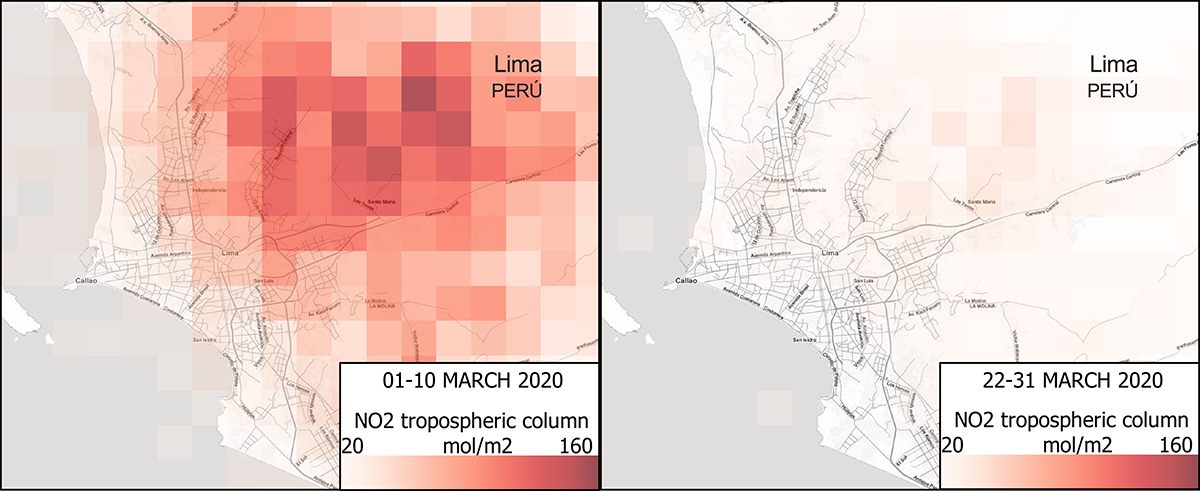
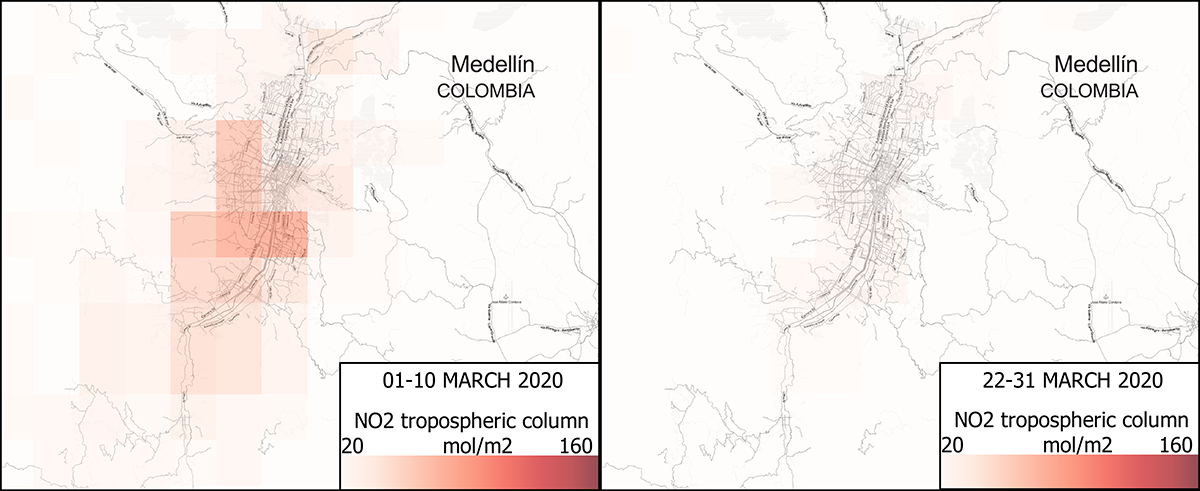
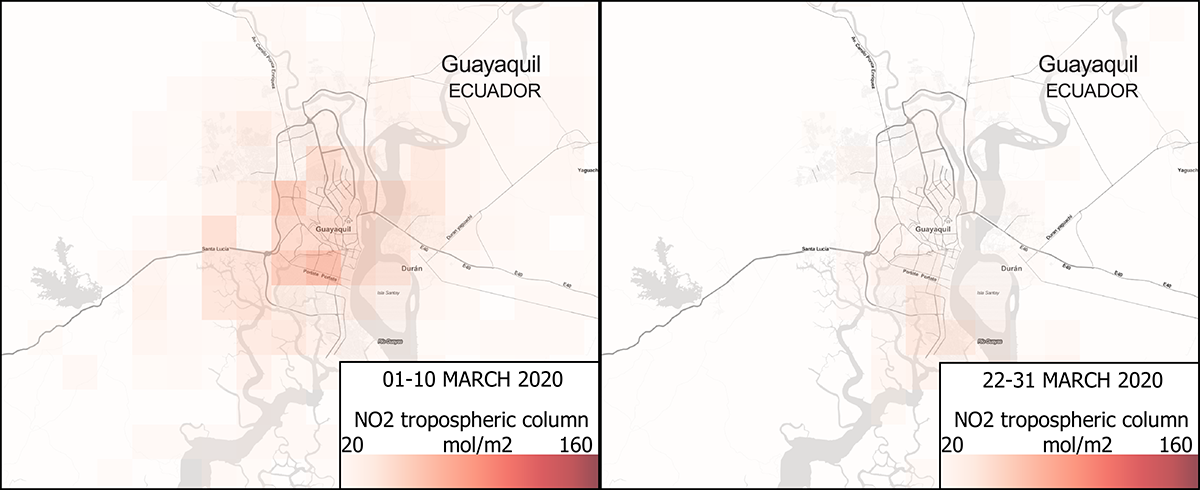
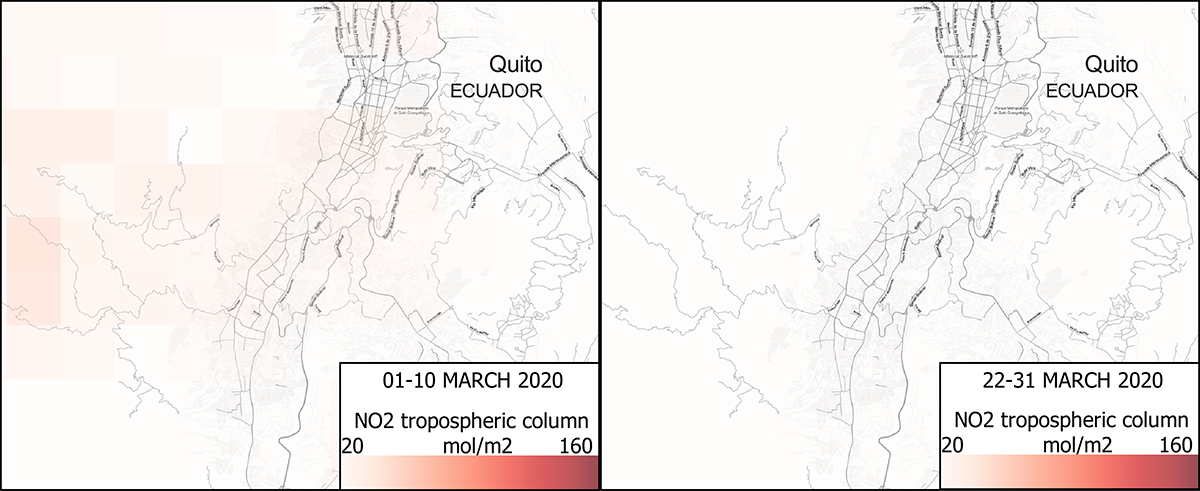
Figure 3. NO2 concentration changes in cities in countries with partial lockdowns
Last 10 days v. First 10 days of March 2020
While satellite data makes it easier to measure NO2 concentrations across the world, NO2 is just one of many pollutants affecting air quality. Other culprits include carbon monoxide (CO), sulfur dioxide (SO2), and ozone (03), as well as particulate matter (PM10 and PM2.5). The adverse health effects of these pollutants, and cities’ ability to monitor air quality, depend on local weather, wind, and environmental factors. Tracking pollutants also requires installing monitoring stations throughout a city, to create an air quality alert system that captures data in different environments. While some cities in the region have numerous air quality monitoring stations, such as Mexico City (35), São Paulo (29), or Santiago (13), most do not.
Therefore, our results offer just one approximation of the pandemic’s impact on air quality. Ideally, more data is needed to better understand what is happening on the ground, particularly in cities where we see few changes in NO2 concentration levels. For example, a recent IDB blogpost shows that in Santiago de Chile, the coronavirus crisis has caused a consistent decrease in CO and particulate matter based on data reported by air quality monitoring stations. We also need to better understand what specific measures of social distancing are causing these impacts.
Overall, our data shows a downward trend in the concentration of air pollutants when looking at NO2 levels, particularly in countries with total lockdowns. This trend may indicate that economic activity is slowing down in the region, signaling the need for more in-depth analysis to understand what areas of the economy are most affected.
Blue skies ahead?
A key concern is whether the cleaner air we observe in the region will only last as long as this crisis does. Data from China shows that pollution levels have been increasing as people resume normal economic activities. Also, once businesses shift from crisis to recovery mode, they may be forced to prioritize urgent expenses over environmentally-friendly investments.
But what if the blue skies in Lima and elsewhere offer a glimpse into what the future could hold if the public and private sectors turn this unprecedented crisis into an opportunity to rethink business as usual and rebuild in a more sustainable way? Many institutions, companies, and workers have already come to realize that working from home and forgoing commutes is indeed possible. We might also see more digital businesses operating in the future and a greater array of home delivery options. This window of cleaner air could also help shed light on the need to ramp up ongoing efforts to electrify public transport in the region’s cities.
While much uncertainty remains, it is clear that we, as a development bank, need to continue tracking the changes happening in our region during this crisis, to provide timely support and help countries and the private sector recover on a path to sustainable growth.

Leave a Reply