
Measuring accessibility in cities with mobility data platform APIs (/navigation app APIs)
We live in a data-driven world where 2.5 quintillion bytes of data is produced every day. These huge quantities of information provide the basis for an unprecedent richness of knowledge if structured and processed. The good news is that many of these data sets are freely available and openly accessible. Google Maps, Moovit, Citymapper, or Transit App, among others: open data has the great potential to inform for improving public policy.
One obvious beneficiary of the development can be transportation planning, specifically from a transport accessibility perspective. But why is so important to understand transport accessibility in the Latin America and Caribbean countries? According to Litman (2019) accessibility refers to the ease of reaching goods, services, activities and destinations, which together are called opportunities. It can be defined as the potential for interaction and exchange (Hansen 1959; Engwicht 1993). For example, grocery stores provide access to food. Libraries and the Internet provide access to information. Paths, roads and airports provide access to destinations and therefore activities (also called opportunities). Accessibility is the ultimate goal of most transportation activity. In other words, better transport accessibility leads to more and better opportunities to increase the quality of life of LAC population and the competitiveness of their economies.
Luckily, there is a growing amount of literature using the API of mobility data platforms (navigation apps) to measure accessibility of mobility systems worldwide. As examples, Hadas (2013) uses Google-transit data to assess public transport systems in Canada, USA, and New Zealand. Wu (2019) compares different APIs working with travel time data. Also Here you may find a list of publicly-accessible public transportation data feeds for a huge sample of cities worldwide. And here also you may find a description of main public transportation APPs’APIs and Platforms.
However, in Latin America and the Caribbean there are still barriers to harvesting these new data sources.
As examples, public transportation system of major cities of the region such as Lima (Peru) or La Paz (Bolivia) are not incorporated in the world’s most popular navigation app, Google Maps. In addition, the data for public transportation in some Latin American cities is fragmented and varies significantly between different mobility platforms – see for example the cases of Mexico City (Mexico), or Quito (Ecuador), among many others.
Also, when it comes to LAC, existing platforms need to improve in order to provide consistent and comparable data. As an example of variations across data platforms, we compare Google Maps, and Moovit, the largest urban mobility data and analytics company in the world, for the case of Buenos Aires (Argentina). We quantified accessibility in terms of the travel time that is required to access opportunities and services. We assessed the access level from different areas of the city of Buenos Aires to the city center, through public and private transport. For this, we simulated arbitrary points in all the different neighborhoods of the city, by using TOMTOM MyDrive. This data platform also allows to model private transportation, as it provides traffic analysis of every minute of every day since 2008. Subsequently, we modeled the time required from these points by public transport towards the same central point in the city center, by using Google Maps and Moovit. We modeled the required time during the morning and the evening peak as well as during off-peak time at midday. The following table shows the results:
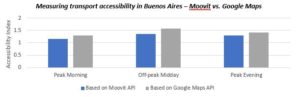
The accessibility indicator compares the travel time to reach a centric point of a city in private car and public transport. The comparison shows that the results vary significantly according to the platform used. In the case of Buenos Aires, the results based on Moovit show that during the morning peak it takes 16 % more time to reach the urban center in public transport than in private car. During off-peak midday it takes 35 % and during evening peak 29 % longer to reach the urban center via public transportation. The numbers increase to 29 % during the morning peak, 58 % during midday and 41 % in the evening by running the same exercise using the API from Google Maps. While both data platforms show how insufficient accessibility is damaging public transport competitiveness in terms of travel time, the comparison between platforms shows that the discrepancy between the accessibility of public and private transport varies considerably depending on the different transport platforms.
While platforms need to better fit when it comes to LAC cities, there still lays great potential in the richness of data from the mobility data platforms and it is worthwhile to examine the data in order to make informed decisions. Acknowledging the potential differences between platforms, we expanded the exercise to a sample of cities in Latin America in order to calculate an accessibility indicator.
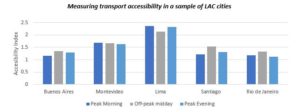
Overall, the data shows that, when it comes to accessibility, public transport is systematically underperforming private transport.
Every single LAC city in the sample is constantly less accessible by public transport than by private car. This result is consistent throughout all times of the day. Even in rush hour there is no temporal advantage for public transportation. In peak morning, a public transport user spends on average 137% (Lima) than a private transport user: this represents that, on average, a public transport user may spend almost 40 minutes more than a private transport user to complete the same distance. In the case of Montevideo, the public transport users needs 68 % more time. In Santiago de Chile a person needs to plan with at least 20 % more time if the person chooses to take the public transport over the private car. At off-peak midday the extra time required increases to more than 50 % – which on average represents more than 12 minutes. While this post shows some initial numbers on transport accessibility in the region, there is an urgent need to 1) completely understand how accessible the public transport network in LAC is; 2) identify potential measures to improve accessibility in the region; and 3) fully unlock potential benefits from open data in LAC transport policy.
This exercise represents a teaser trailer of IDB’s search for generating information about infrastructure services in Latin America and the Caribbean. Our research will be expanded in the next Development in the Americas 2020 report. We will keep you posted.
Nice Article keep posting good information, Thank you for sharing this.